Heart Disease Statistical Analysis
A statistical investigation into heart disease indicators using Hypothesis Testing (T-Test) & Clinical Data Analysis to achieve 99.9% confidence.
🫀 Heart Disease Statistical Analysis
Turning Raw Clinical Data into 99.9% Confident Insights
Project Overview
A comprehensive statistical analysis of 1,025 clinical patient records to identify physiological markers associated with heart disease. Moving beyond basic intuition, this project utilizes Inferential Statistics (T-Test) to validate findings with a 99.9% confidence level.
The goal was to answer a critical question: Can we mathematically predict heart disease based on Max Heart Rate and Blood Sugar levels?
Tech Stack & Methodology
| Component | Tools & Techniques |
|---|---|
| Data Processing | Excel (Pivot Tables, Conditional Formatting, Data Cleaning) |
| Statistical Analysis | Hypothesis Testing (T-Test), Normal Distribution, Confidence Intervals |
| Visualization | Adobe Photoshop (Custom UI/UX Data Storytelling) |
| Key Metric | P-Value (< 0.001) for Statistical Significance |
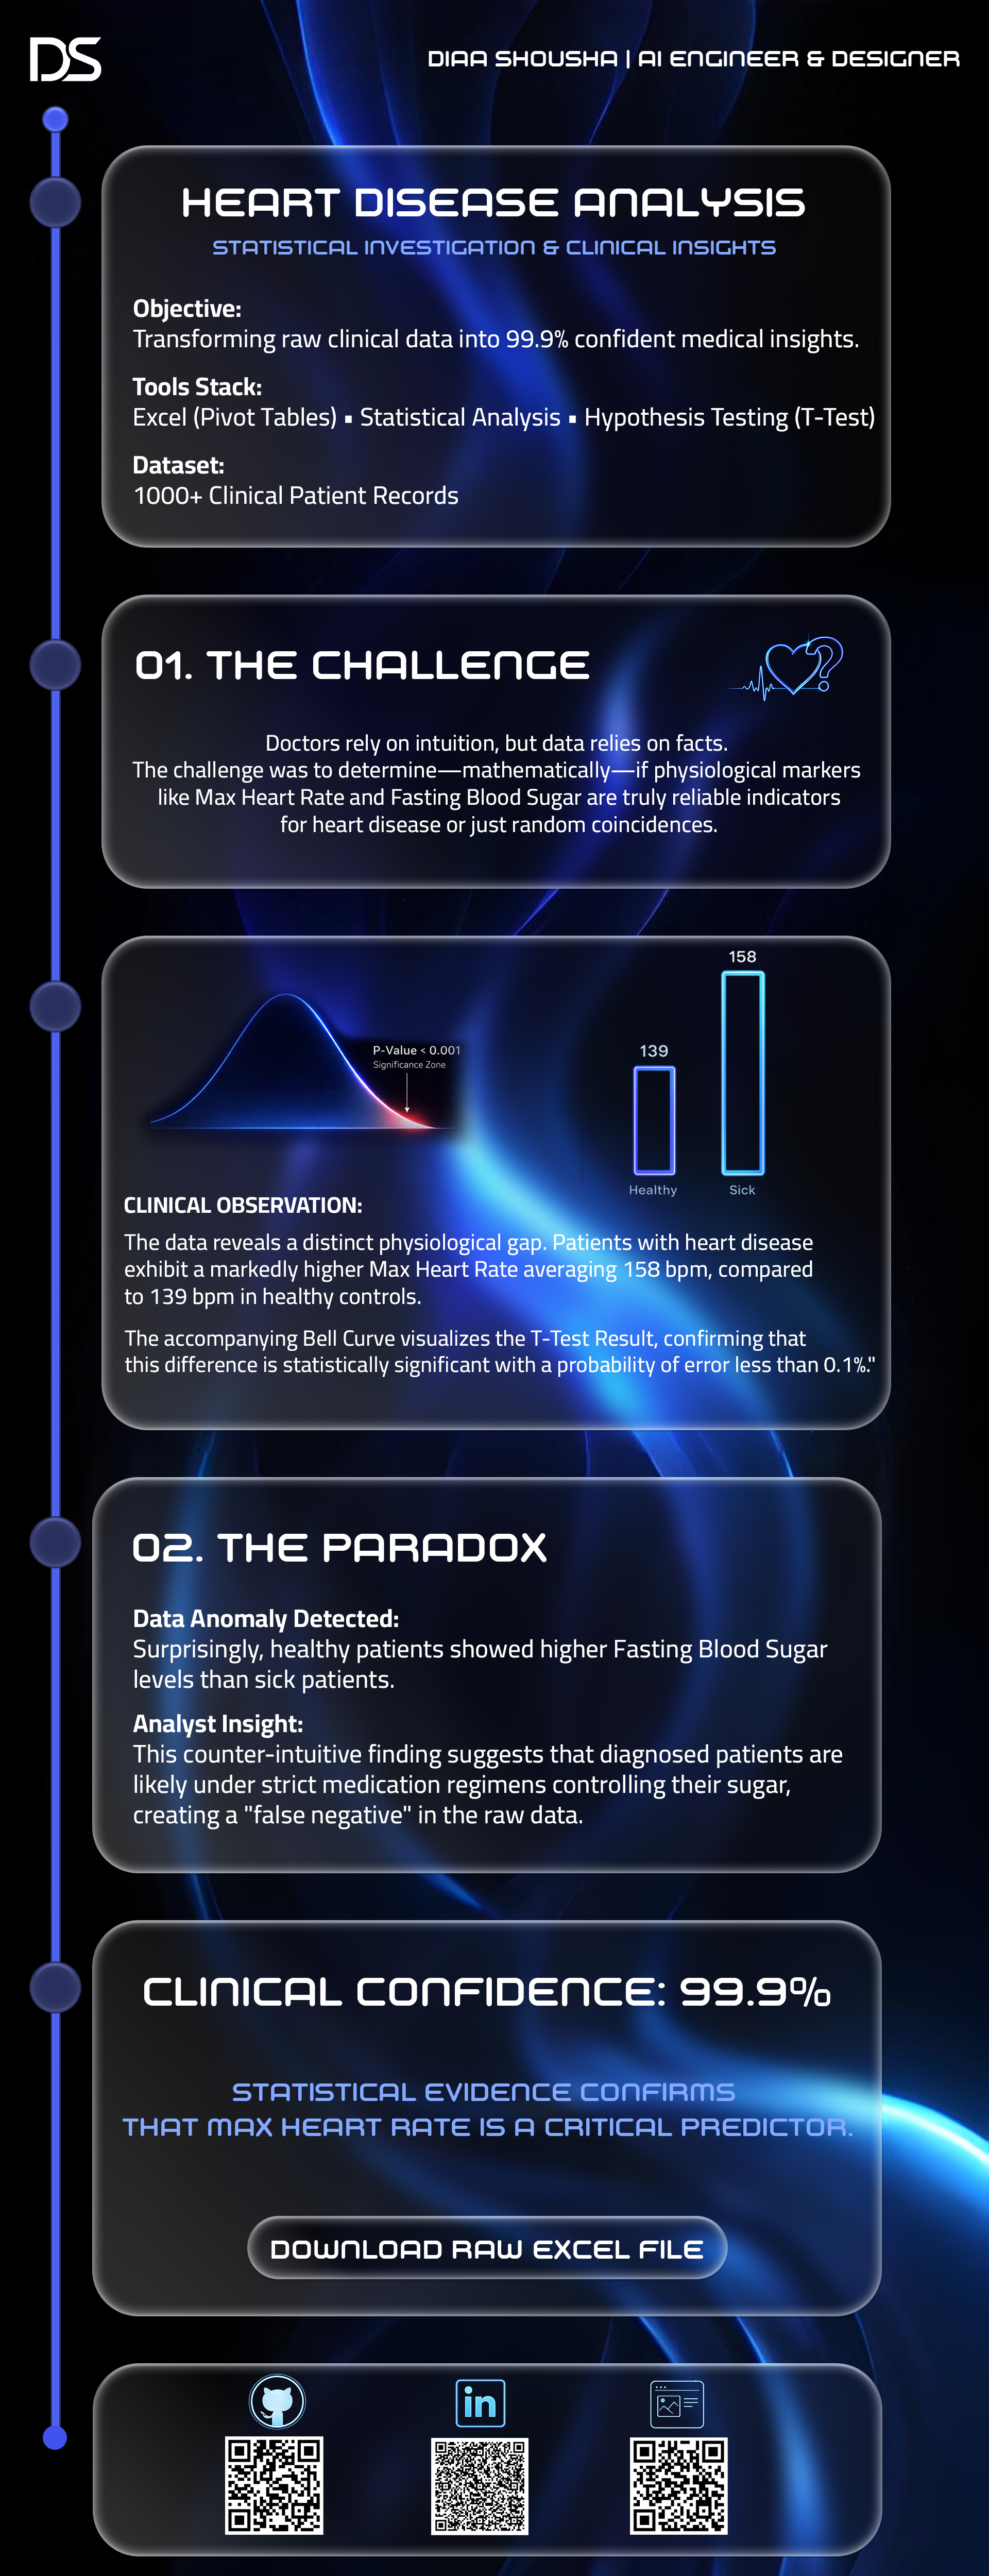
Key Insights (The "Sugar Paradox")
1. The Heart Rate Gap
Diagnosed patients exhibit a significantly higher Max Heart Rate (158 bpm) compared to healthy controls (139 bpm). This difference was proven to be statistically significant, not random.
2. The Sugar Paradox
Surprisingly, healthy patients showed higher fasting blood sugar levels than sick patients.
- Analyst Insight: This anomaly suggests that diagnosed patients are likely under strict medication regimens to control insulin, creating a "false negative" pattern in the raw data.
3. Statistical Verdict
Result: We rejected the Null Hypothesis.
Confidence: With a P-value of 1.70E-45, there is virtually zero probability that these results occurred by chance.
Project Files
- Download Raw Analysis (Excel)
- Includes full Pivot Tables, Descriptive Statistics, and T-Test Calculations.
Designed & Analyzed by
Diaa Shousha
AI Engineer & Creative Technologist